-
WebReport
-
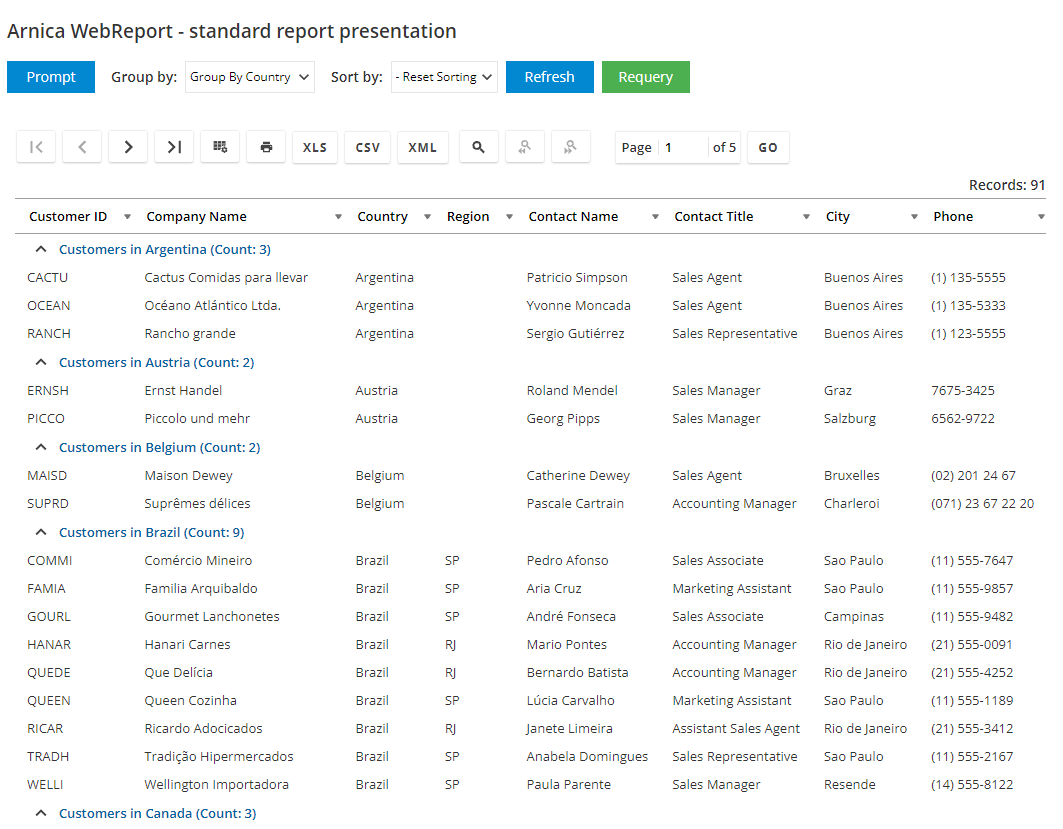 Standard report presentationThis report presents data using the default template with frequently used features.
 -
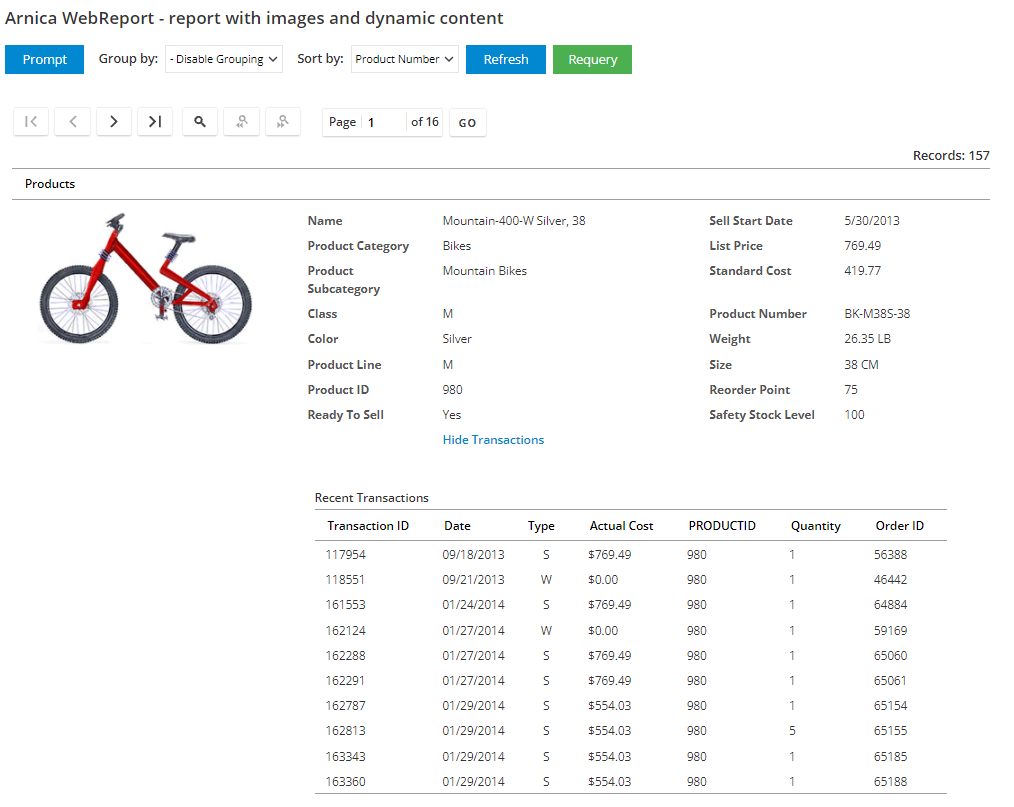 Report with images and dynamic contentThis report displays products as line items. Each row has free-form formatting, with one cell spanning across the entire row. The report dynamically pulls a product image from a database. For each product, the report provides a link to view transactions, which are retrieved as a result of running another report in real time. Presentation of the transaction report within the cell of the main report is achieved through AJAX technology.
 -
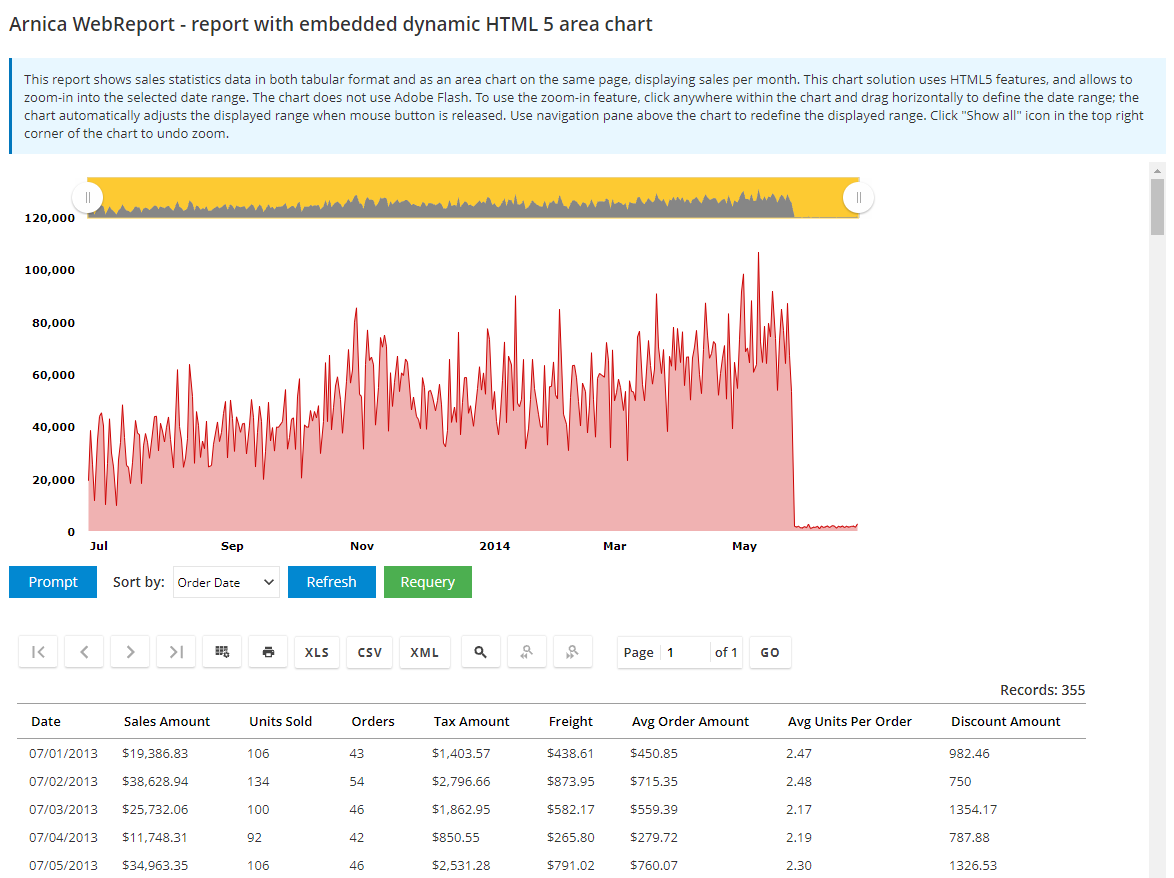 Report with embedded dynamic HTML 5 area chartThis report shows sales statistics data in both tabular format and as an area chart on the same page, displaying sales per month. This chart solution uses HTML 5 features, and allows to zoom-in into the selected date range. The chart does not use Adobe Flash.
 -
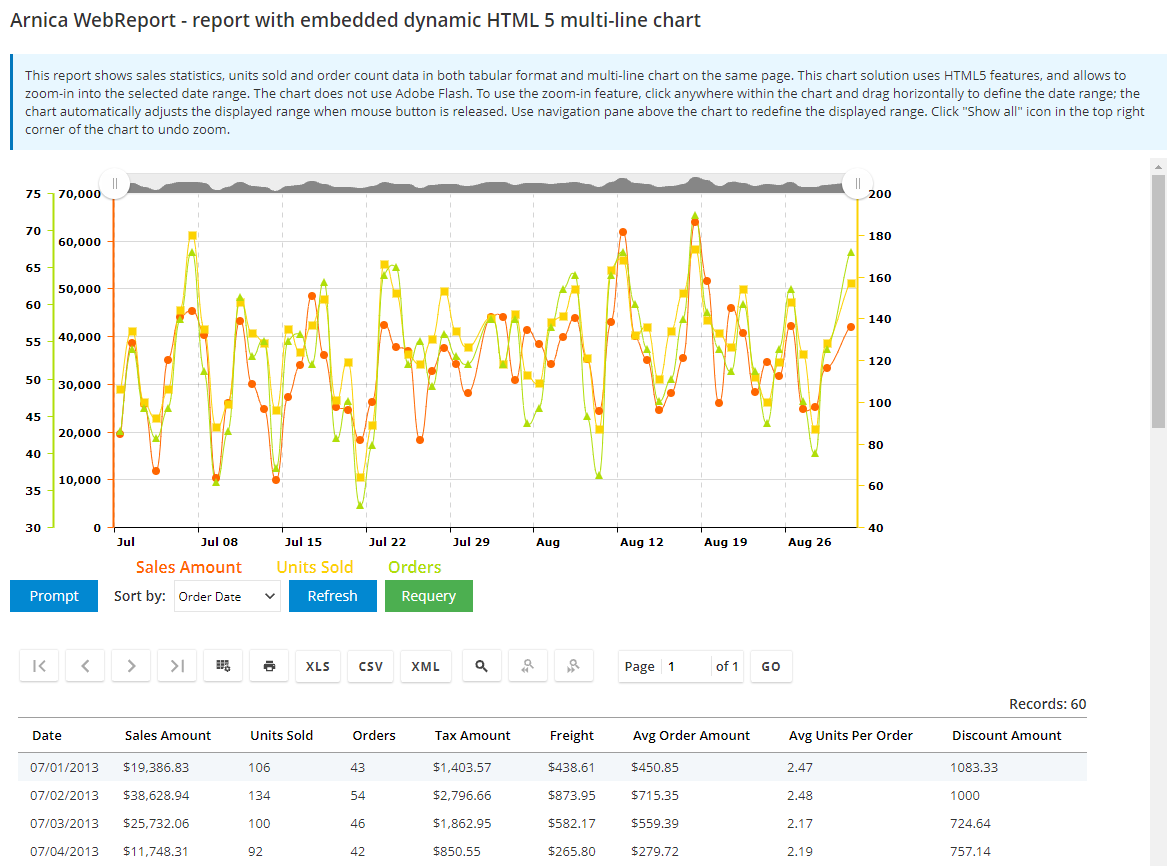 Report with embedded dynamic HTML 5 multi-line chartThis report shows sales statistics, units sold and order count data in both tabular format and multi-line chart on the same page. This chart solution uses HTML 5 features, and allows to zoom-in into the selected date range. The chart does not use Adobe Flash.
 -
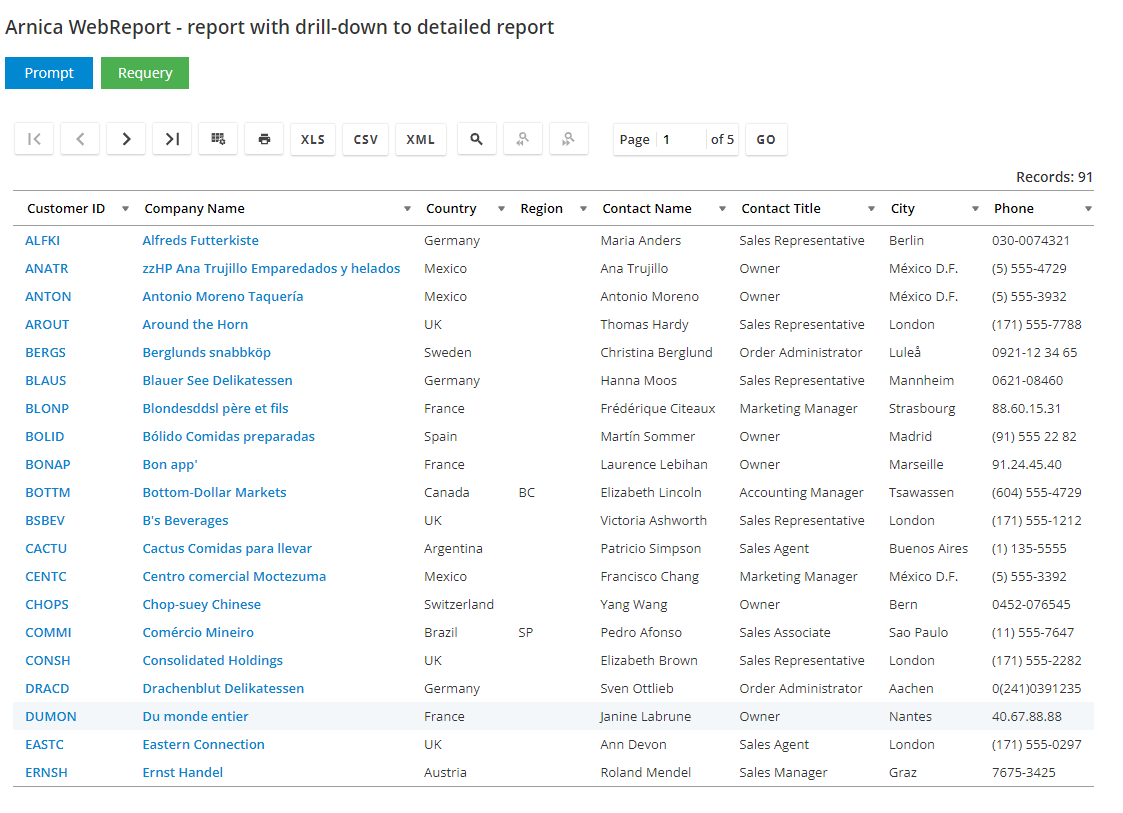 Report with drill-down to another reportThis report presents data using the default template. One column has been configured as a hyperlink, which drills down to another "child" report. Click on the hyperlink brings up the child report showing details corresponding to the selected record, in this case all orders for the customer with the selected ID. The child report also has a link to return to the parent report. Alternatively, the child report may be configured to open in a new window.
 -
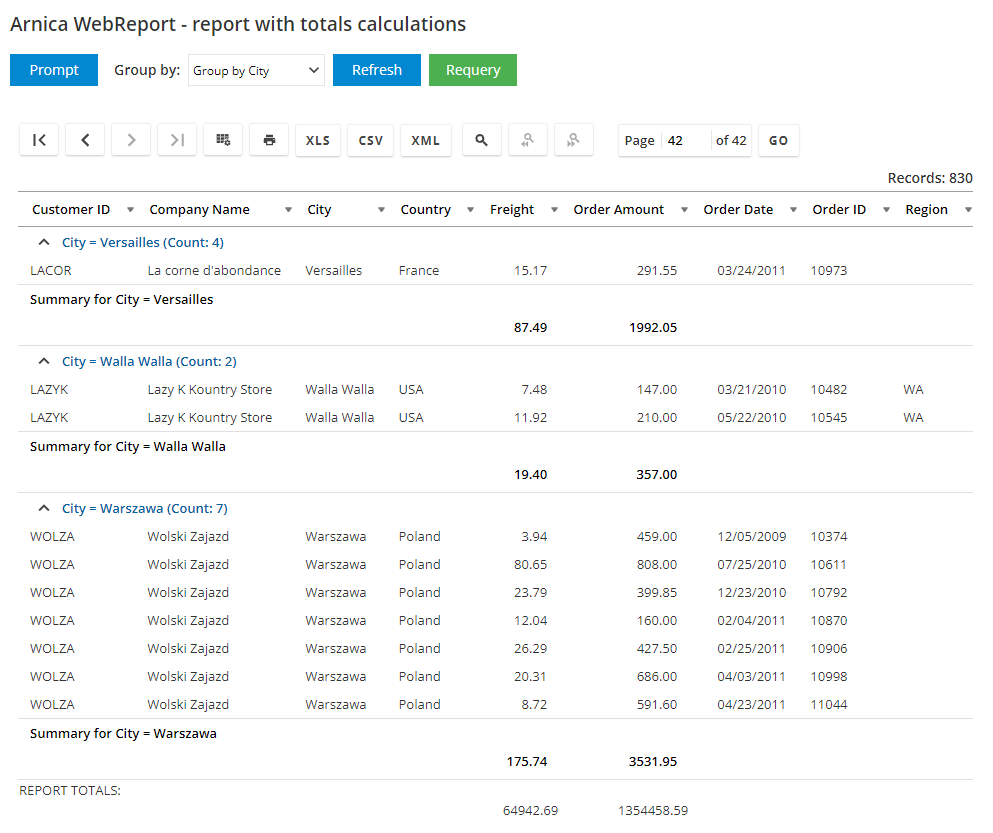 Report with data group totals and grand totalsThis report calculates totals for each data group and the grand-total for the entire report (displayed on the last page). The report automatically recalculates group totals when the grouping criteria change, for example, try to group by county and then by region.
 -
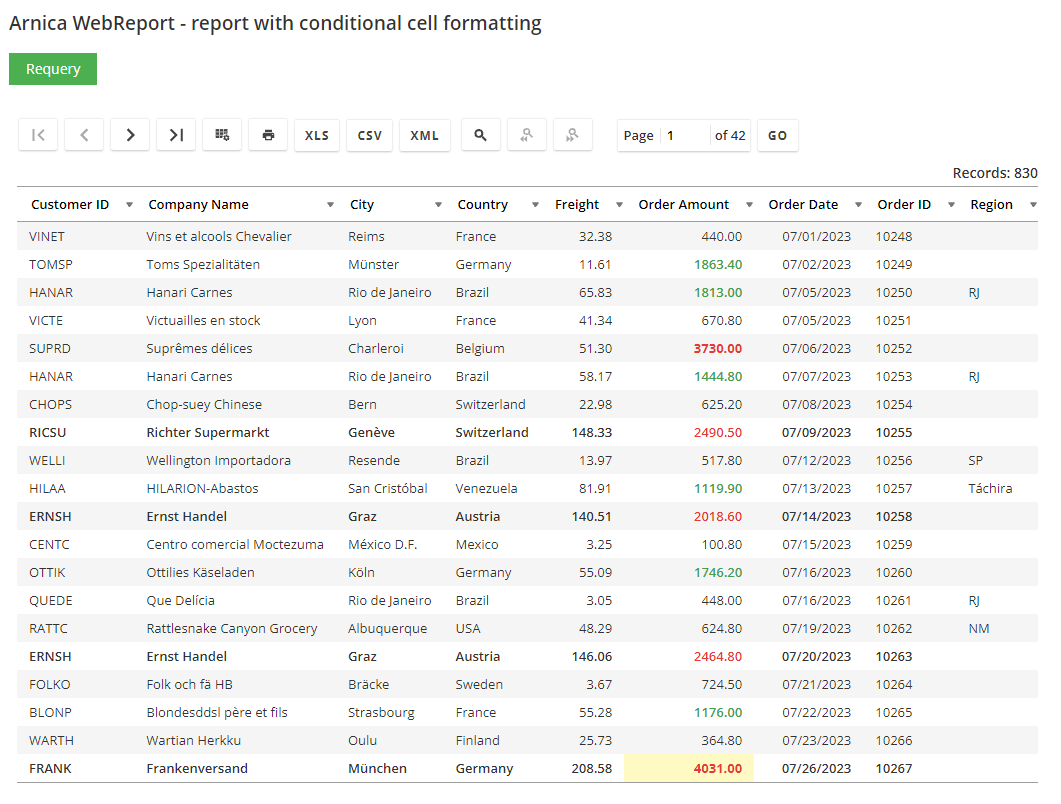 Report with conditional cell formattingThis report uses conditional cell formatting, where the format of cell content (font, font size and color) is modified depending on cell value.
 -
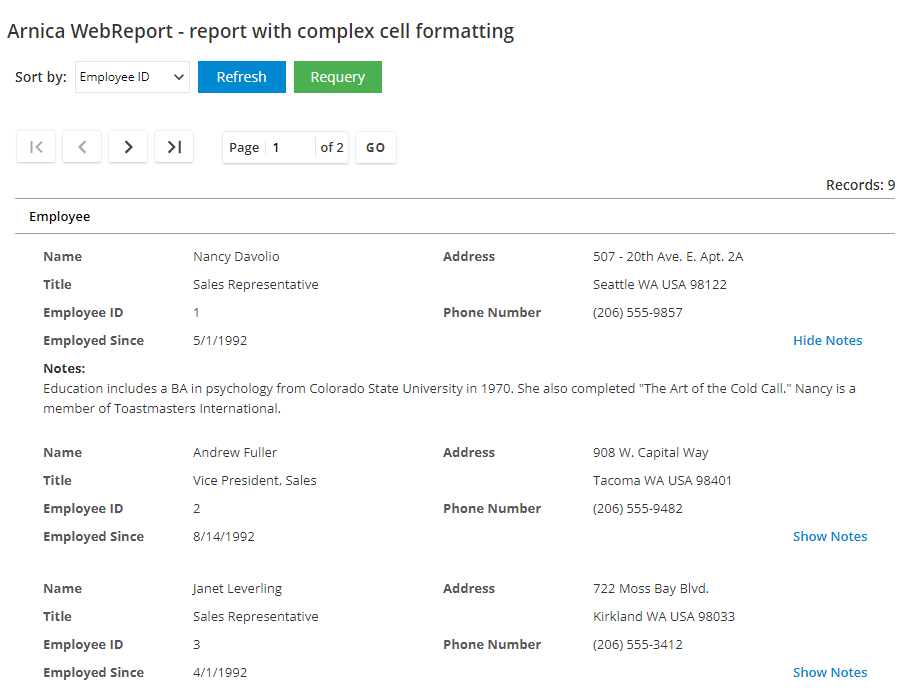 Report with complex cell formattingThis report uses one container cell per row, which spans across the entire row. This type of cell allows presentation of free form content with any level of complexity, it may also include a hyperlink to dynamically control how much data is presented in each cell.
 -
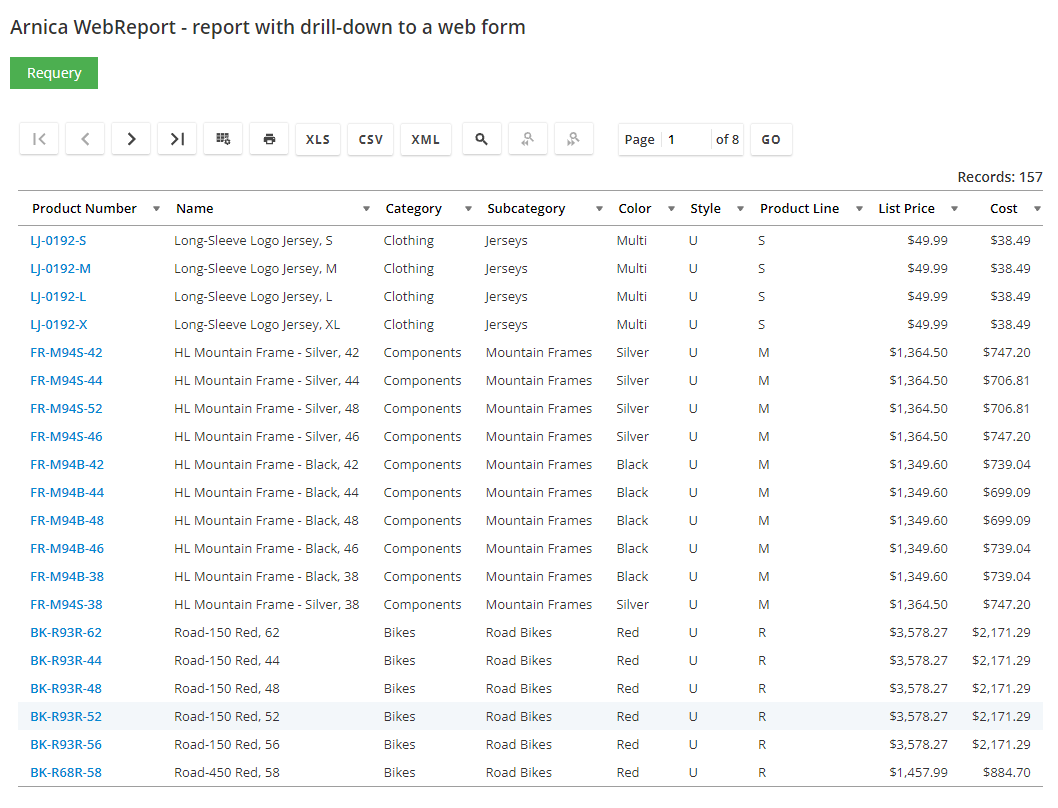 Report with drill-down to a web formThis report has one column configured as a hyperlink, which drills down to a web form. Click on the hyperlink brings up the properties of selected record, which then may be updated. The form provides a link to return to report and select another record.
 -
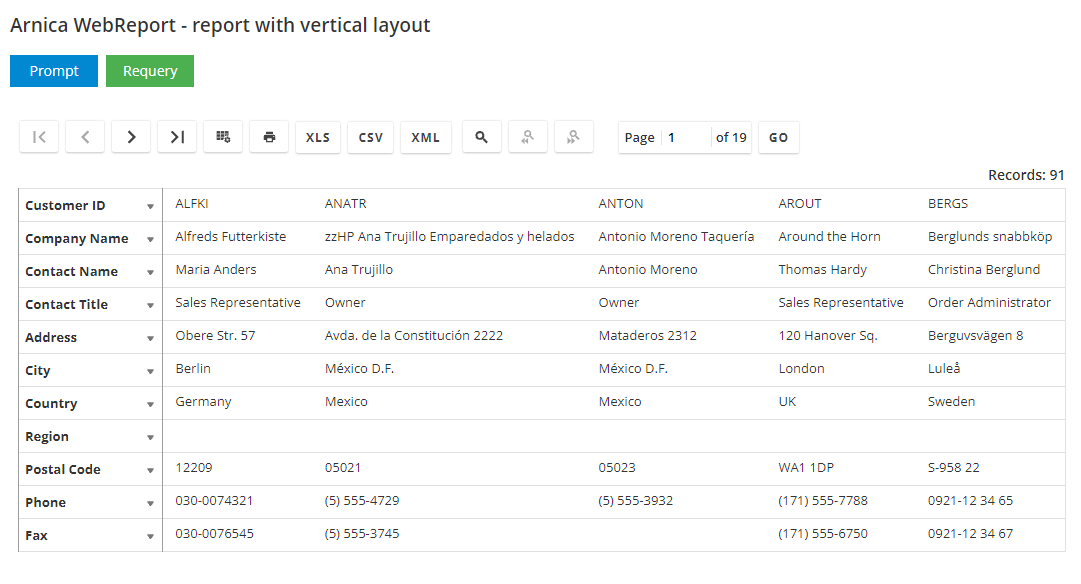 Report with a vertical layoutThis report has a vertical layout, where, instead of the conventional horizontal report layout when rows are presented as a sequence of fields from left to right, data is presented in a vertical sequence of fields as a column. This layout may be useful in specialized cases, for example when there are too many columns for each record and horizontal scrolling is not desirable.
 -
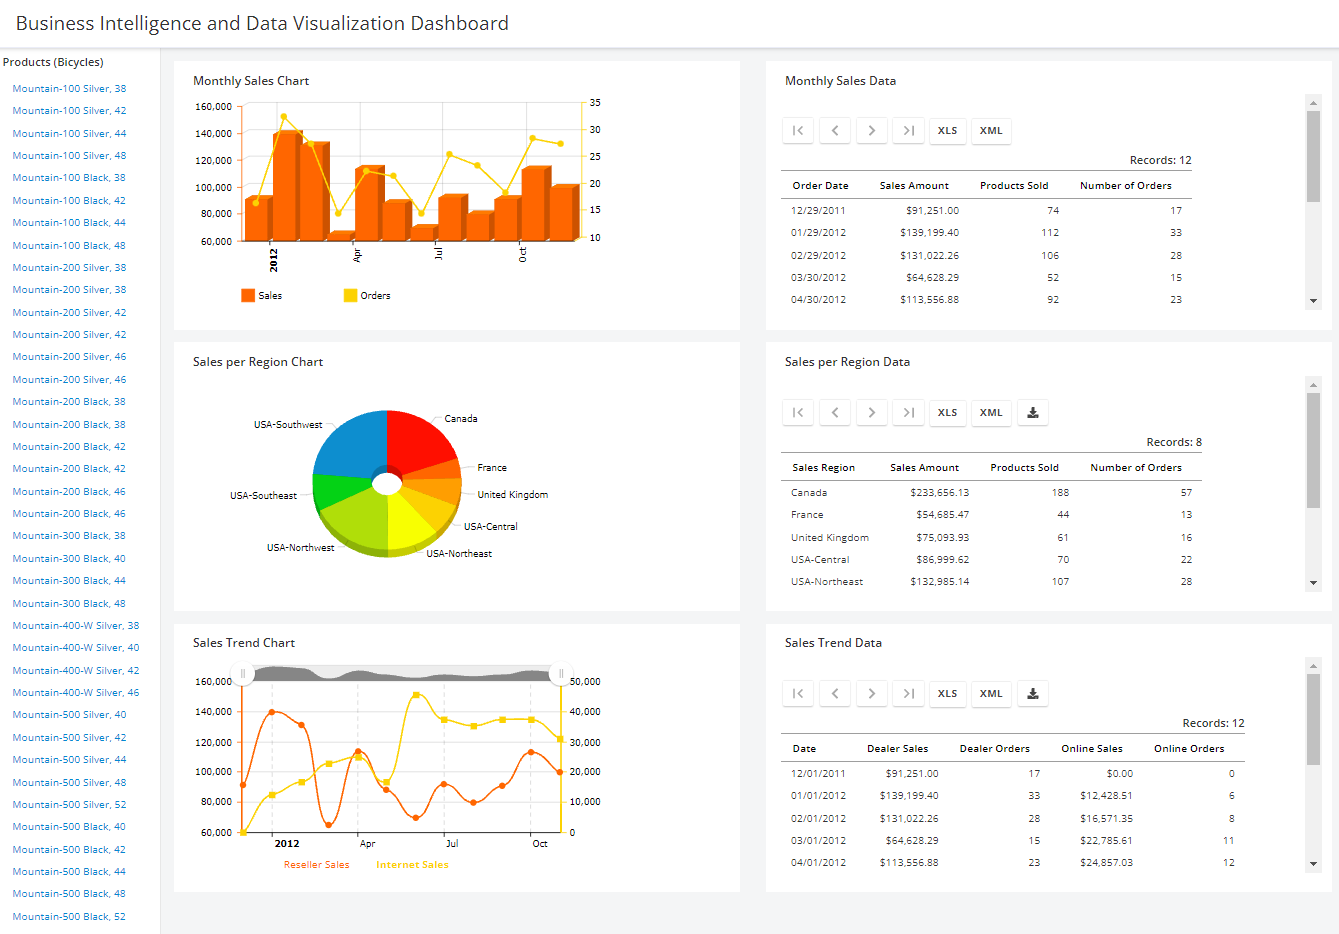
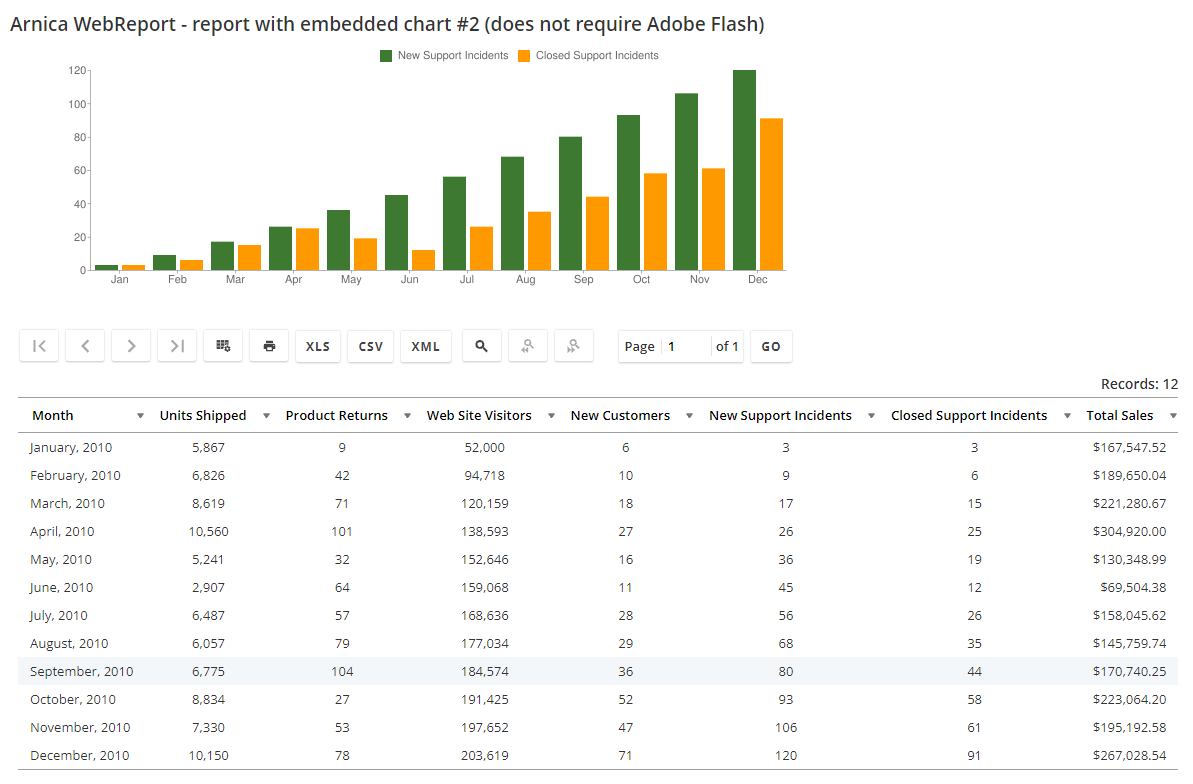 Report with embedded chartThis report shows both sales statistics data in tabular format and a bar chart displaying units sold per month on the same page.
 -
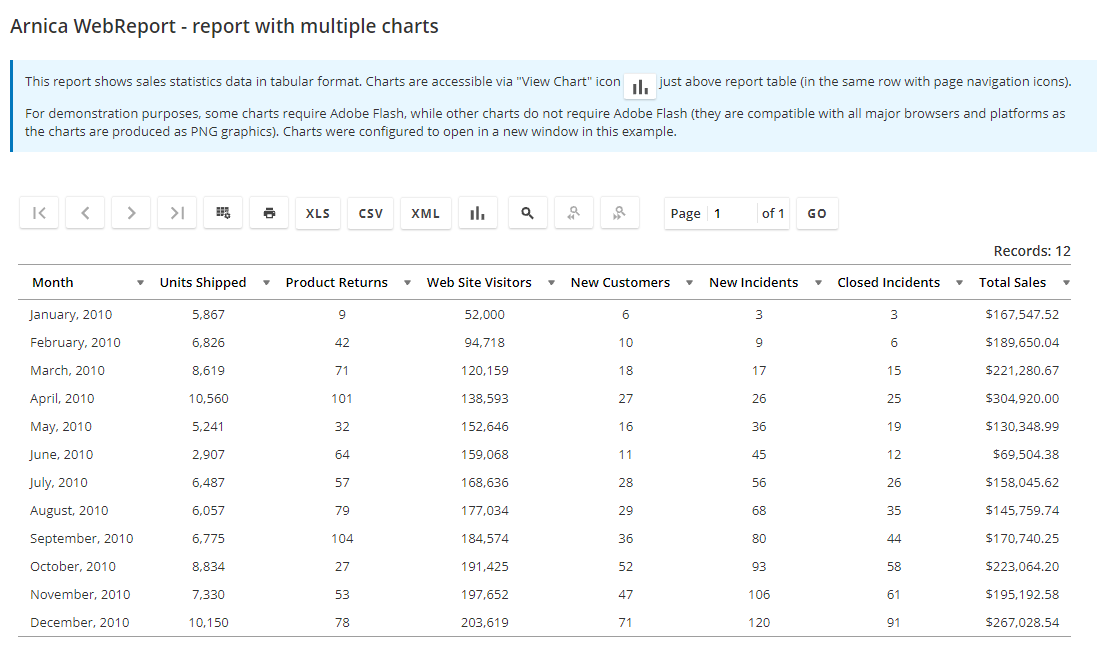 Report with multiple chartsThis report shows sales statistics data in tabular format. Charts are accessible via the "View Chart" icon just above the report table (in the same row as page navigation icons). For demonstration purposes, some charts require Adobe Flash, while other charts do not require Adobe Flash (these are compatible with all major browsers and platforms as charts are produced as PNG graphics). Charts were configured to open in a new window in this example.
 -
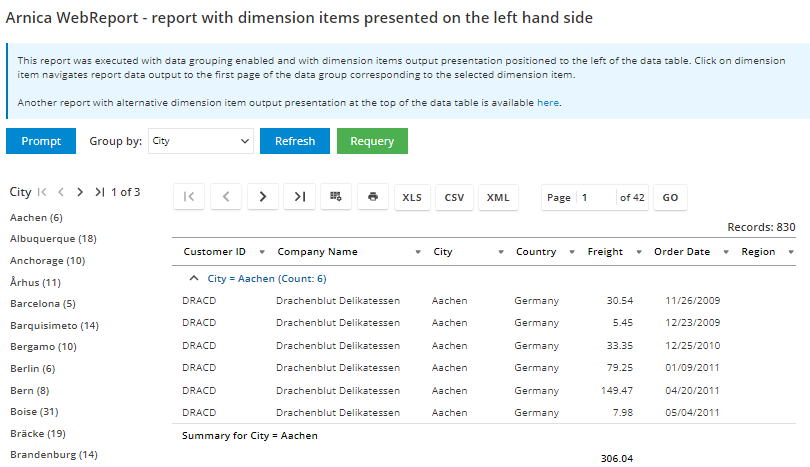 Report with dimension items presented on the left hand sideThis report is executed with data grouping enabled, as well as with dimension items output presentation positioned to the left of the data table.
 -
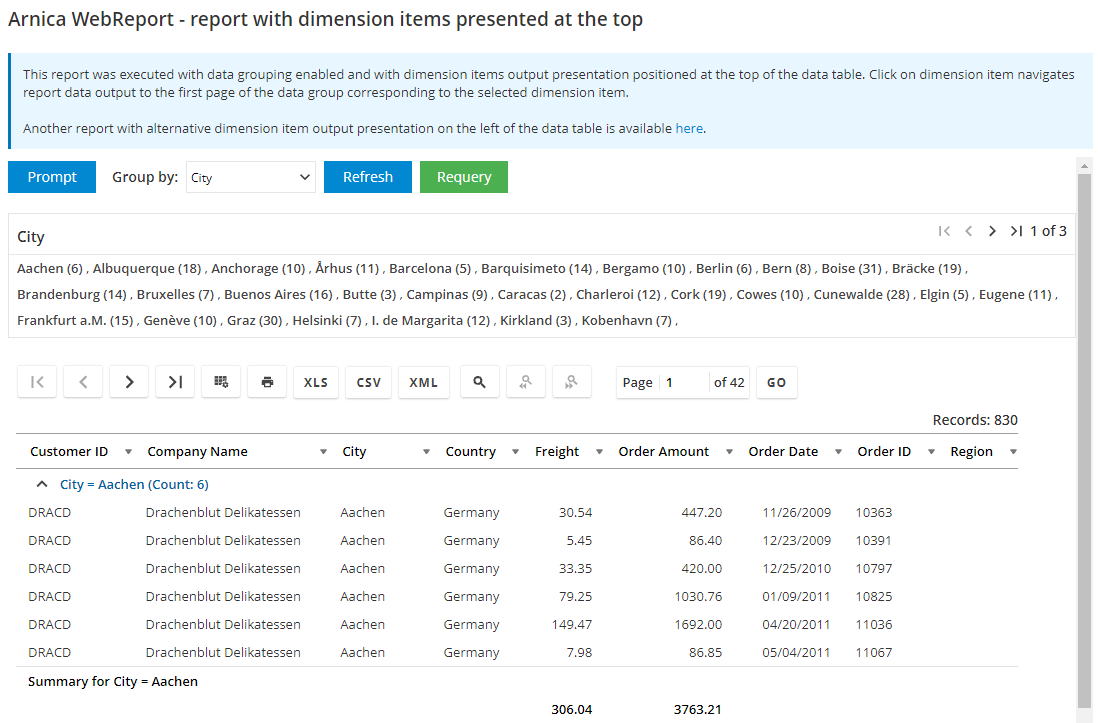 Report with dimension items presented at the topThis report is executed with data grouping enabled, as well as with dimension items output presentation positioned at the top of the data table.
 -
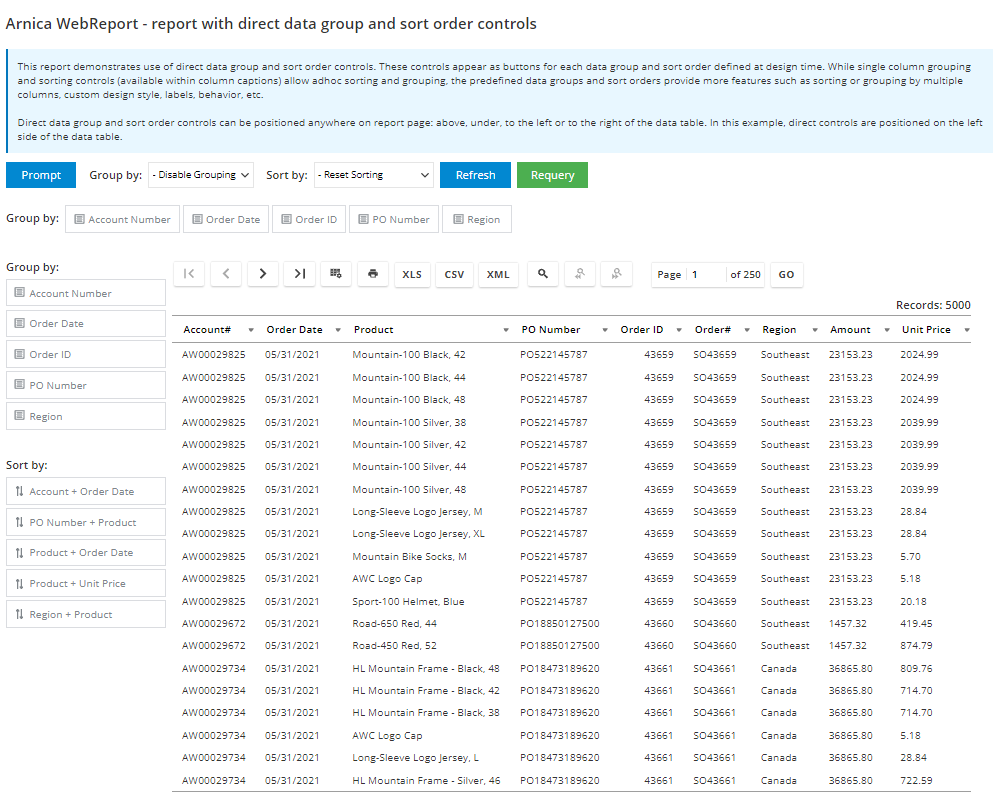 Report with direct data group and sort order controlsThis report demonstrates use of direct data group and sort order controls. These controls appear as buttons for each data group and sort order defined at design time. While single column grouping and sorting controls (available within column captions) allow adhoc sorting and grouping, the pre-defined data groups and sort orders provide more features such as sorting or grouping by multiple columns, custom design style, labels, behavior, etc.
 -
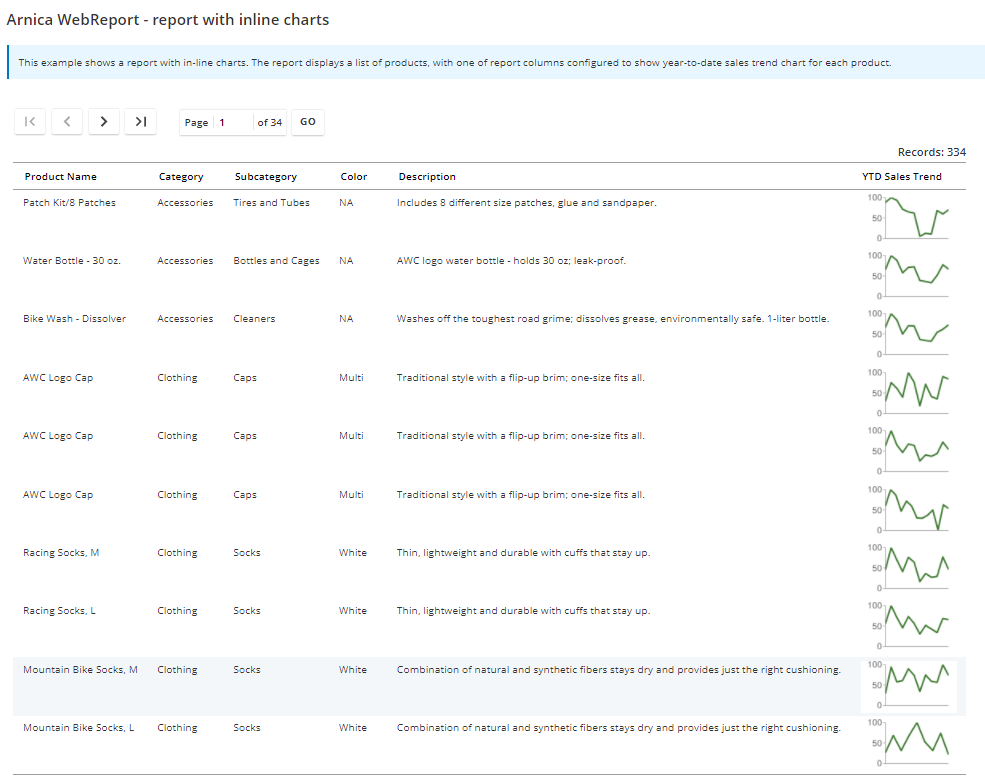 Report with inline chartsThis example shows a report with inline charts. The report displays a list of products, with one of report's columns configured to show a sales trend chart for each product.
 -
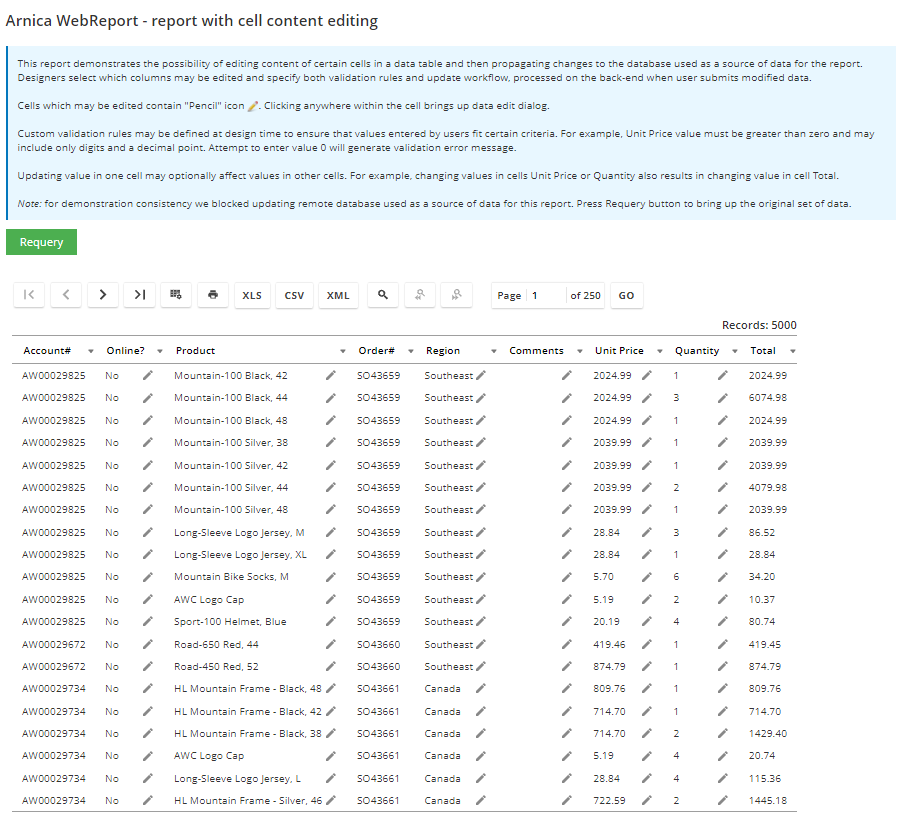 Report with cell content editingThis report demonstrates the possibility of editing content of certain cells in a data table and then propagating changes to the database used as a source of data for the report. Designers select which columns may be edited and specify both validation rules and update workflow. Cells which may be edited contain "Pencil" icon .
-
-
WebPortal